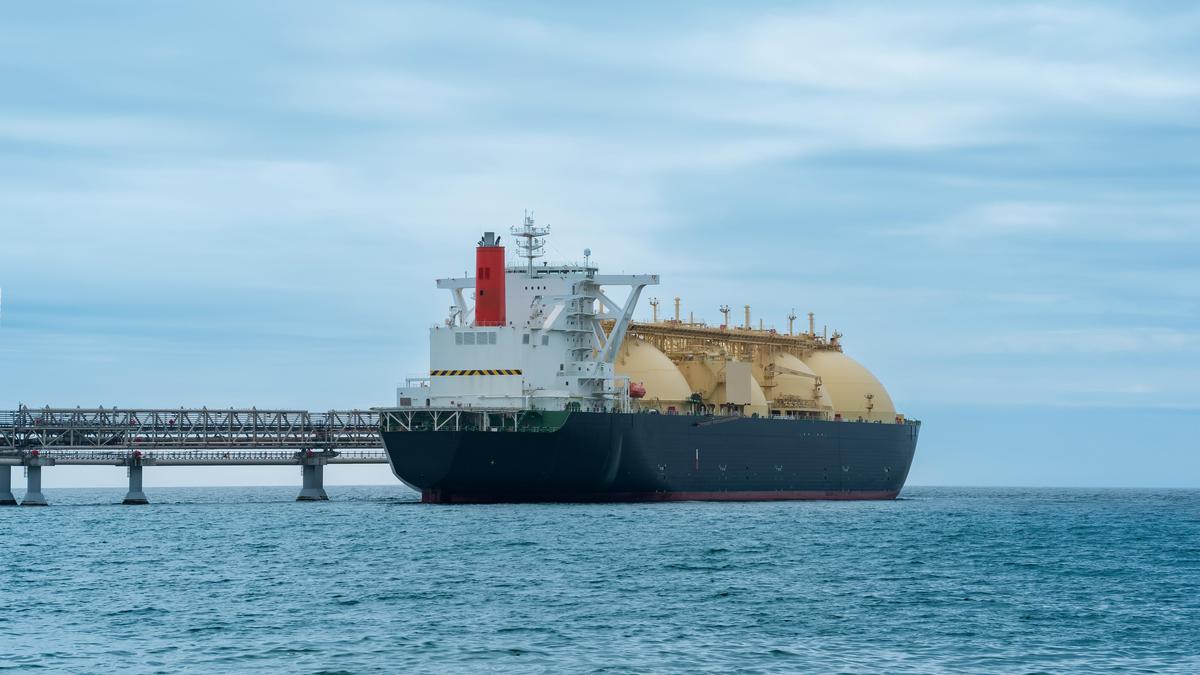
On May 19, 2026, the liquefied natural gas (LNG) carrier Perle docked at China's Beihai terminal, completing a voyage that lasted 162 days. The vessel had loaded its cargo at Gazprom’s Portovaya LNG facility on the Baltic Sea on December 8, 2025. Under standard operating conditions, a maritime LNG delivery from northern Europe to East Asia requires 30 to 45 days. The Perle's near six-month transit represents a structural distortion of energy logistics, illustrating the compounding friction of Western sanctions imposed on Russian energy architecture.
The voyage highlights a broader strategic shift: the systemic breakdown of traditional energy trade routes and the emergence of a highly complex, inefficient alternative distribution framework. While headlines frame this successful delivery as a sanctions-evasion victory for Moscow, an evaluation of the underlying operational data, infrastructure constraints, and economic trade-offs reveals a different reality. This delivery is an example of an unsustainable supply chain operating under severe structural duress. If you found value in this post, you should read: this related article.
The Friction Function of Sanctions Enforcement
The multi-month delay of the Perle was not the result of mechanical failure or adverse weather, but rather the manifestation of a highly effective regulatory blockade. In February 2025, Washington and its allies expanded targeted sanctions to encircle major Russian LNG production nodes, including Novatek’s Arctic LNG 2 project and Gazprom’s Portovaya facility. This regulatory framework attacks the maritime supply chain through three specific pressure points.
- Pillar 1: Sovereign Demurrage and Buyer Rejection. Tankers originating from sanctioned facilities face immediate cargo-clearance risks at international ports. The Perle spent months idling at sea because sovereign buyers calculated that the legal and financial penalties of accepting the cargo outweighed the utility of the energy. A clear example of this occurred simultaneously in South Asia: the LNG tanker Kunpeng, which loaded cargo at Portovaya and set a course for India in mid-April 2026, was rejected by Indian authorities despite domestic energy deficits. The vessel was forced to alter course, remaining idle off the coast of Malaysia as a stranded asset.
- Pillar 2: The Deprivation of Maritime Insurance and Classification. Under current Western compliance regimes, International Group of P&I Clubs insurers are barred from underwriting vessels carrying sanctioned assets. Without specialized hull and machinery protection, standard transit routes like the Suez Canal become operational bottlenecks due to strict transit requirements. This forces sanctioned vessels into longer, riskier open-ocean voyages or prolonged periods of stationary holding while ownership structures are masked.
- Pillar 3: The Shadow Fleet Deficit. Unlike crude oil, which can be easily transported in decades-old, un-insulated tankers, liquefied natural gas requires advanced, double-hulled vessels equipped with cryogenic containment systems to maintain a temperature of -162°C. The global pool of non-Western aligned, ice-class, or specialized LNG carriers is extremely small. Russia cannot easily scale a "shadow fleet" for gas; consequently, every day a specialized asset like the Perle sits idle, a fixed portion of Russia's total export capacity is effectively neutralized.
The Boil-Off Rate and Technical Degradation
The primary thermodynamic limitation of using an LNG carrier as a floating storage unit for half a year is cargo degradation, measured by the boil-off gas (BOG) rate. Even the most advanced membrane or MOSS-type containment systems experience heat leakage, causing a portion of the liquid cargo to revert to a gaseous state during transit. For another perspective on this event, refer to the recent coverage from Reuters Business.
For a standard modern LNG carrier, the daily boil-off rate typically ranges between 0.08% and 0.15% of the total cargo volume. When a vessel is in motion, this vaporized gas is directed to the ship's dual-fuel diesel-electric propulsion systems as fuel. However, during extended periods of idling or low-speed maneuvering—such as the Perle's five-month holding pattern—the cumulative volume of boiled-off gas changes the economics of the voyage.
$$\text{Total Cargo Loss} = \text{Initial Volume} \times (1 - \text{Daily BOG Rate})^{\text{Days at Sea}}$$
Applying this formula over a 162-day duration demonstrates that between 12% and 22% of the initial cargo volume was either consumed purely to keep the vessel operational or vented/oxidized via gas combustion units to manage tank pressure. This means the net delivered volume at the Beihai terminal was significantly smaller than the volume loaded at Portovaya, creating an immediate penalty on the nominal value of the transaction before accounting for transport costs.
The Logistics Cost Function: Asia vs. Europe
The structural pivot of Russian LNG from European waters to Asian markets has rewritten the underlying cost functions of the trade. Prior to the 2027 European Union phase-out target, a standard round-trip voyage from Russia's western or Arctic terminals to Northwest Europe required 17 to 20 days, carrying an average transport cost of $1.00 to $1.50 per million British thermal units (mmBtu).
Redirecting these exact volumes to East and South Asian markets alters the logistical math across three primary geographic pathways:
| Route Option | Average Transit Duration | Estimated Logistics Cost (per mmBtu) | Primary Operational Constraints |
|---|---|---|---|
| Suez Canal Transit | 50–60 Days | $2.60 – $3.00 | High exposure to Western insurance verification; geopolitical choke points. |
| Northern Sea Route (NSR) | 50–65 Days | $3.80 – $4.10 | Severe seasonal ice windows; extreme deficit of Arc7 ice-class tankers. |
| Cape of Good Hope Route | 70–80 Days | $3.20 – $3.50 | Extreme distance; maximum exposure to boil-off degradation. |
Maritime data reveals that the cheapest year-round option to India and southern China remains the Suez Canal route, which requires trans-shipment operations in ice-free ports like Murmansk to shift cargo from specialized ice-class hulls to standard LNG carriers. However, when a vessel is barred from standard port calls and forced into a 162-day holding pattern, the implied logistics cost spikes past $6.00/mmBtu. At this level, the freight premium completely consumes the arbitrage profit margin between European and Asian gas benchmarks, forcing the seller to absorb steep financial losses.
Asymmetric Interdependence: The Sino-Russian Energy Nexus
China’s acceptance of the Perle at the Beihai terminal highlights the calculated approach Beijing brings to its energy relationship with Moscow. China is not acting out of geopolitical altruism; it is exploiting its position as the buyer of last resort to lock in steep discounts on primary commodities.
This relationship creates an asymmetric interdependence. For Russia, the Chinese market is an existential necessity to maintain hard currency inflows and prevent the physical shut-in of upstream gas wells, which are costly and technically difficult to restart once frozen. For China, Russian seaborne LNG is an opportunistic supplement to a highly diversified import portfolio that includes long-term pipeline contracts with Turkmenistan and seaborne volumes from Qatar and Australia.
By accepting cargoes from sanctioned projects like Portovaya and Arctic LNG 2, Chinese state enterprises leverage their sovereign legal insulation to demand steep price discounts, offset by the high regulatory risks they assume. The Beihai terminal has effectively become a specialized clearinghouse for distressed, sanctioned energy assets.
The Long-Term Operational Blueprint
The delivery of the Perle confirms that the physical flow of Russian LNG to China can be maintained under conditions of extreme regulatory containment, but it establishes that the economic viability of this trade is deteriorating. A system that requires half a year to execute a single delivery cannot compete with standard global energy supply chains.
The strategic play for energy market participants is clear: monitor the utilization and velocity of the specialized LNG shadow fleet rather than just tracking absolute export volumes. If the average laden days at sea for Russian gas carriers remains above 90 days over the next two quarters, it will signal a structural bottling of Russian supply. This dynamic will reduce global LNG liquidity, keep spot prices volatile in the Pacific basin, and force non-aligned buyers to choose between absorbing high-friction, deeply discounted Russian molecules or paying a premium for Western compliance-cleared alternatives.