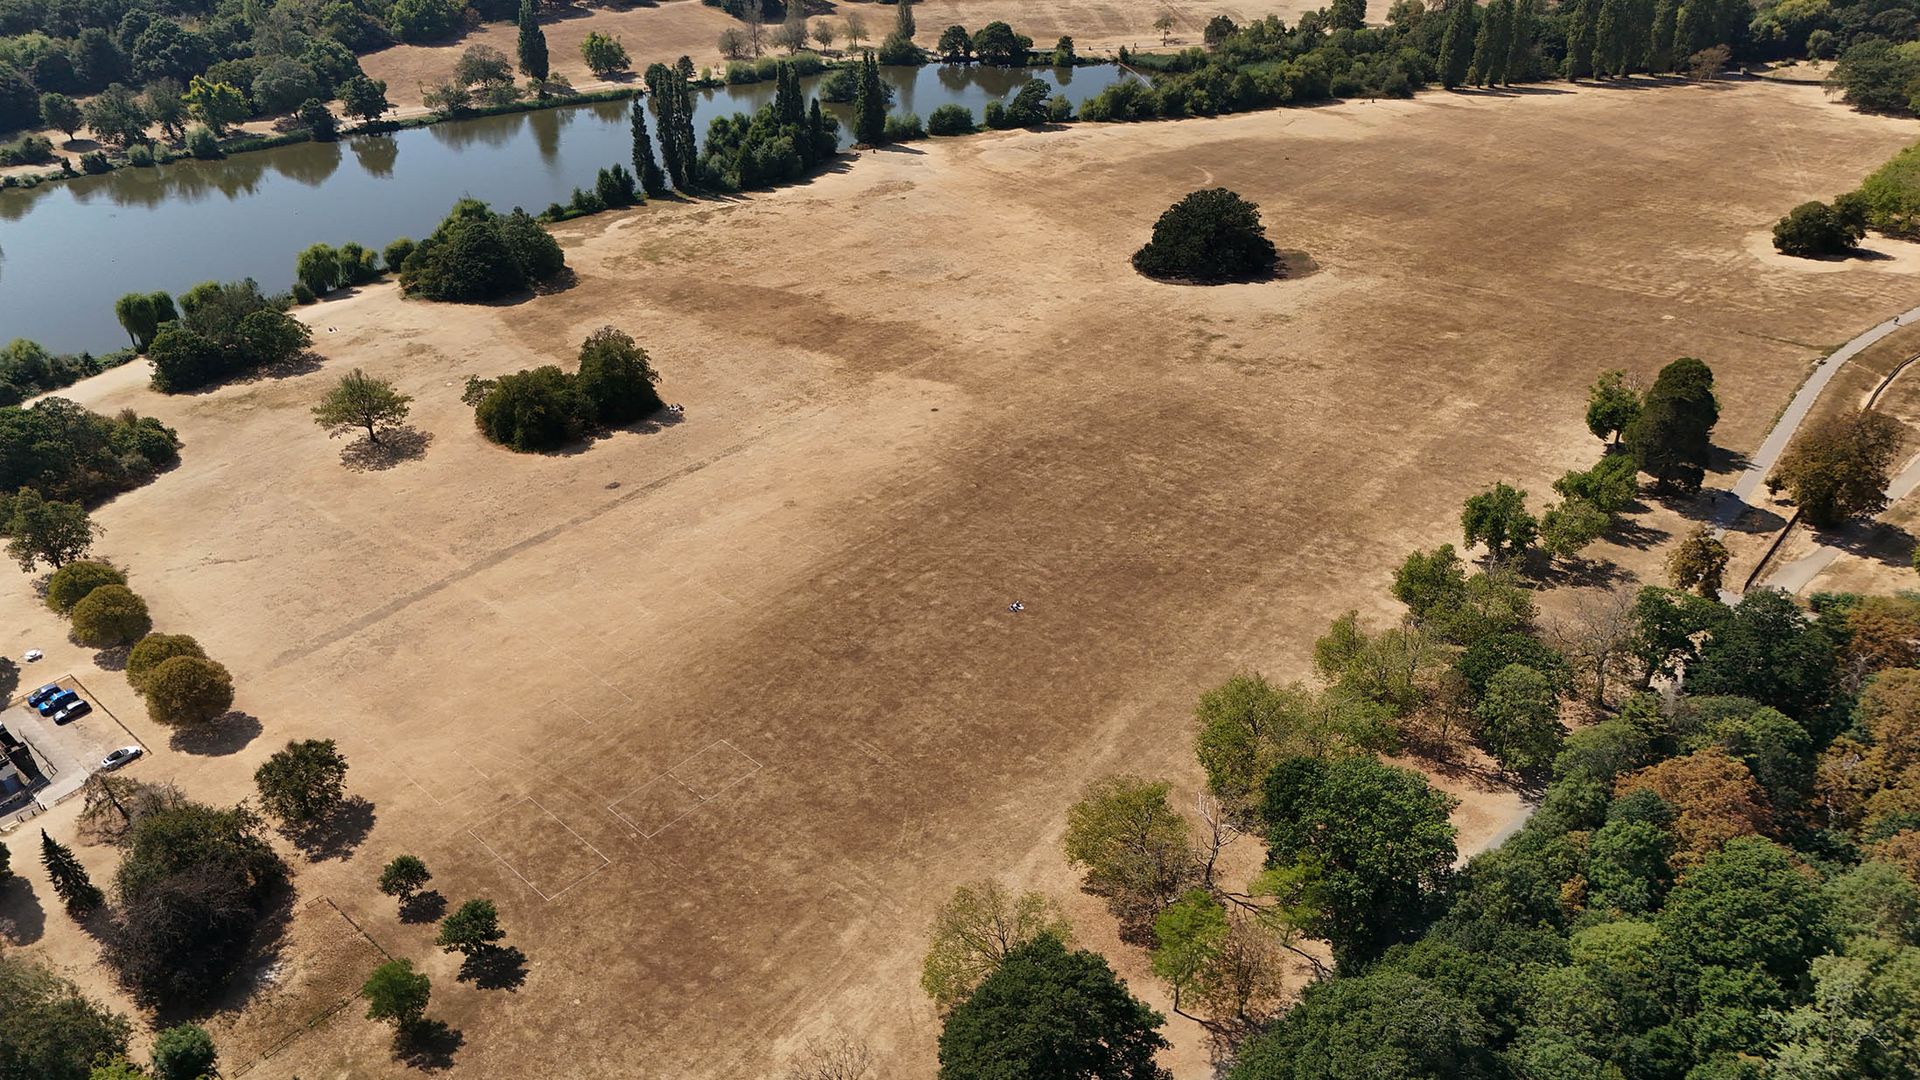
Global temperature metrics have crossed a structural threshold. Recent data from the European Union Copernicus Climate Change Service confirms that global average surface temperatures reached 1.65 degrees Celsius above pre-industrial baselines, tying the historic record set during July 2023. This persistent departure from historical norms is frequently mischaracterized in media reports as a sequence of isolated weather spikes. A rigorous analysis reveals a different reality: these observations mark a permanent reconfiguration of planetary energy budgets. Understanding this deviation requires separating underlying thermodynamic drivers from transient cyclical phenomena, quantifying the systemic impacts on infrastructure, and evaluating the failure modes of legacy climate baselines.
The Architecture of Planetary Heating Don't forget to check out our recent article on this related article.
The attribution of modern temperature anomalies relies on isolating two distinct variables: anthropogenic forcing and natural climate variability. Natural cycles, specifically the El Niño-Southern Oscillation, act as short-term amplifiers. An active El Niño phase releases heat stored in the tropical Pacific Ocean into the atmosphere, shifting global averages upward. However, empirical attribution models demonstrate that this natural mechanism contributes only one to two tenths of a degree Celsius to the total anomaly.
The primary structural driver remains the accumulation of long-lived greenhouse gases in the troposphere. The combustion of fossil fuels, industrial chemical processes, and land-use changes alter the radiative forcing of the atmosphere. Incoming solar radiation passes through the atmosphere, but outgoing longwave thermal radiation is absorbed and re-emitted downward by carbon dioxide, methane, and nitrous oxide molecules. This imbalance prevents the Earth-atmosphere system from reaching radiative equilibrium. To read more about the background here, The Washington Post provides an in-depth summary.
The consequences manifest most visibly in oceanic heat storage. Marine systems absorb more than ninety percent of excess anthropogenic heat due to the high specific heat capacity of water. When upper-ocean temperatures match historical records—as recorded across marine monitoring networks—the thermal inertia of these water masses guarantees sustained atmospheric heating for decades, independent of immediate emissions reductions.
Systemic Failure Modes of Historical Baselines
Standard climatological comparisons utilize a pre-industrial baseline, typically defined as the mid-to-late nineteenth century. Operating against this baseline exposes the limitations of legacy risk assessment tools used by governments and industrial operators. When regional metrics exceed historical extremes—such as the continental United States experiencing summer conditions surpassing the peak of the 1936 Dust Bowl—civil infrastructure designed for historical variance parameters experiences structural failure.
The vulnerability vector operates through three primary mechanisms:
- Thermal Expansion of Electrical Grids: High ambient temperatures reduce the current-carrying capacity of transmission lines and force transformers to operate near thermal limits, elevating the probability of cascading grid failures.
- Hydrological Stress: Elevated evaporation rates deplete surface water reservoirs and reduce river discharge across major commercial waterways, disrupting logistics, agricultural irrigation, and industrial cooling operations.
- Material Degradation: Pavement, rail lines, and structural steel experience material fatigue and deformation when exposed to sustained surface temperatures exceeding engineering design thresholds.
These vulnerabilities confirm that climate change is no longer a probabilistic future risk; it is an active stress test on twentieth-century industrial infrastructure.
Quantifying the Acceleration Curve
A critical analytical finding from recent monitoring periods is the compression of record intervals. Historically, global temperature peaks were separated by multi-year intervals driven by strong cyclical events. The current pattern breaks this historical distribution. The hottest months on record have concentrated tightly in the period following mid-2023.
This temporal clustering indicates an acceleration of the underlying trend line rather than linear progression. Climate scientists project that upcoming cyclical shifts, combined with baseline atmospheric loading, will push rolling twelve-month averages even closer to or beyond the 1.8 degree Celsius threshold. The transition from statistical anomalies to baseline expectations implies that organizations attempting to forecast multi-decade capital expenditures can no longer rely on stationary weather assumptions. Risk models must incorporate dynamic volatility algorithms that account for non-linear feedback loops, including Arctic albedo reduction and permafrost outgassing.
Strategic Capital Allocation and Resilience Engineering
Mitigating the financial and operational exposure driven by thermal escalation requires shifting from reactive disaster management to proactive resilience engineering. Asset owners must audit physical capital against localized wet-bulb temperature projections and maximum sustained heat loads rather than historical averages. Supply chain dependencies tied to vulnerable river transport corridors or water-constrained manufacturing hubs demand immediate geographic diversification. Risk management frameworks must treat high-temperature anomalies as a permanent baseline shift, prioritizing capital investments in high-efficiency cooling, decentralized microgrids, and heat-tolerant materials.